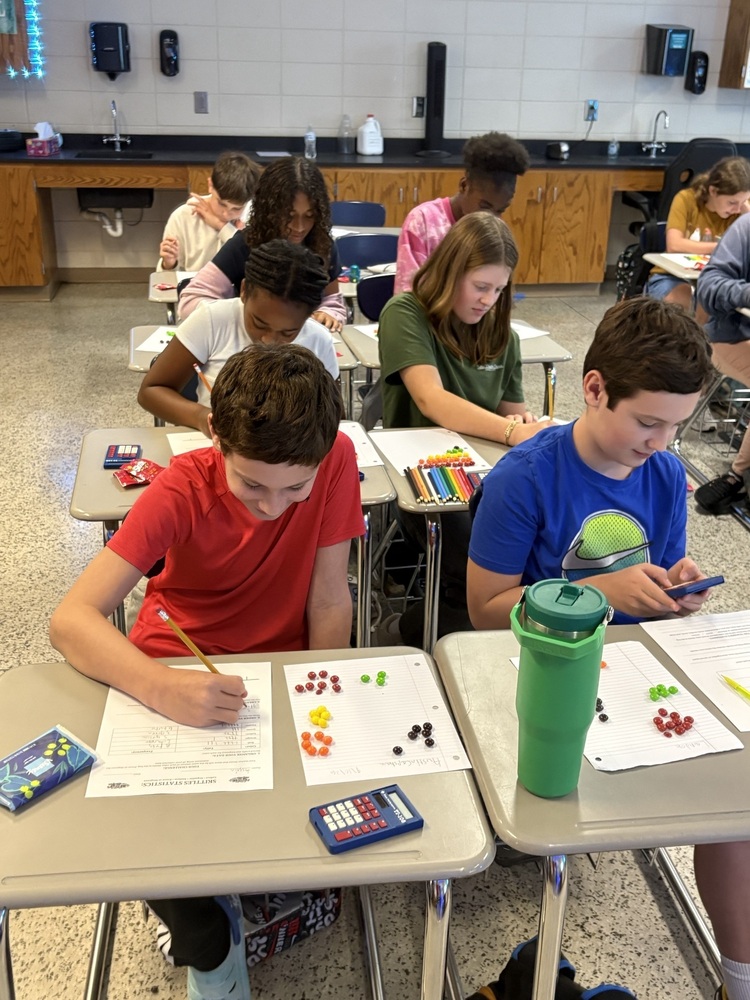
Our 6th grade students completed a skittles activity for our statistics unit. Students used the skittles to collect the frequency at which each color appeared in their packs. They analyzed their data by creating a dot plot to describe the shape and spread of their data, then found the mean, median, mode, and range to gauge whether each color equally showed up in their packs. Thank you to PAWS PTO and families for donating the Skittles for this fun project!